Overview | Outcomes | What we teach | Submit a Challenge | Contact
Master-Student Collaborations in Data Visualization
What is the Data Fair?
The data fair connects you with Master students in Design Informatics to collaboratively work on data visualization projects from Sept-December 2023. We invite external partners to share their real-world data with our students, collaborate on data analysis and visualization, and ideally end up with a project that you can share publicly. The collaboration is open to everyone with data: individuals or organizations, academics or not.
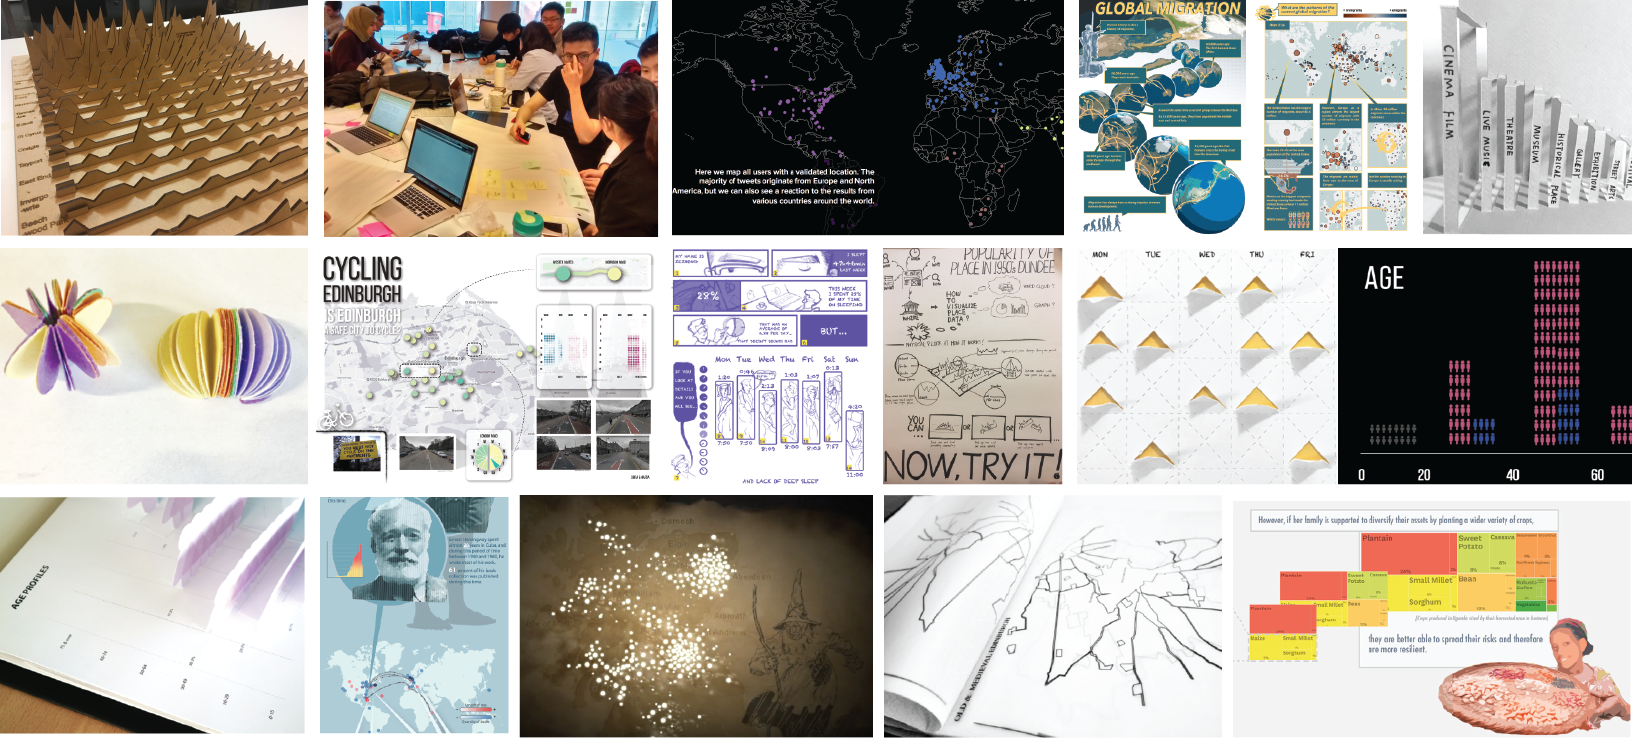
Check our project outcomes from past years.
We will held an open info-session on Friday, Sept 8, 4pm-4:30 on Teams to discuss any questions you might have. Click here to join the meeting, 9Cm9Vy.
The goal for the students is to chose a real-world dataset and an associated challenge for their course Data Science for Design that runs from October to December. Within that course, students will learn the basics of data analysis and visualization. Their assignment requires them to analyze a real-world data set and work on a visualization project that focuses on data exploration and the communication of findings through data visualization. Students will work in groups of three. Projects from past years can be found here.

In case of large numbers of project submissions, we prioritize projects in the area of climate action and the UN Sustainable development.
Why should I participate?
You will have the chance to work with motivated and creative students from a variety of backgrounds: graphic design, media, computer science, product design, etc. You will define a data challenge, i.e., an urgent problem or project you require help with around data analysis and visualization. You are invited to work with the students as close as you wish and attend our lectures and lab sessions (Thursdays 9am-1pm).
We hope that novel collaborations between you and the students and us will emerge. In the past, we had projects leading to published outcomes, continuing collaborations, and master dissertations.
We had worked with: NHS, Scottish Government, Marie Curie, NRS, National Libraries Scotland, Edinburgh City Council, The Peace Rep programme, University of Edinburgh, as well as private persons and companies.
How can I participate?
The commitment from your side will be:
- Submit a data brief and data challenge before September 15th by filling this form (approx. 5-10min). Please, also read How to write a good Data Challenge?
- We will get in touch with you to inform you whether a participation in the data fair is a good choice for you, or whether your data is too complicated or otherwise students will not be able to help you.
- You should present your challenge in 3min on Thursday, 28th September 2023, 10:30am, at InSpace, Informatics Forum (Edinburgh): pitch your data brief for 3min, with the support of slides and any other material you would like to show and ideally stay for 1-2h to discuss with students. We organize a speed-dating session, then we will have an open discussion between you and the students. In case you cannot attend this event, you can send a 3min video or present online. You can bring along any colleagues.
- Students have 2 week to decide on a challenge. Make it easy for students to decide for your challenge
- Students will need access to your data by Mon, October 17. Provide data in an accessible format (e.g., a CSV, Excel, Online API, data base dump) and eventually help them get going.
- During the semester, you could consult with the students as much or little as you like. You are welcome to attend our lectures and lab sessions.
- Students will get regular feedback from tutors and course organizers on their project in the form of discussions and marking feedback.
- Students will first submit a report on the data analysis (~November 15th, 2023). Then will work on a final visualization project.
- Final presentations will happen on November 30th 2023, same location. Students are required to deliver their python code and an extensive data report with measures and visualizations. You are welcome to attend this event and give public feedback.
What are students doing with my data?
Analysis report
Students have 3 weeks to come up with an an individual analysis report (each student, hence 3 per group). Each report consists of an IPython notebook that includes python code and results of an exploratory analysis. Each report should investigate something different and will contain:
- 4-5 exploratory data visualisations, presented in a readable way and provided with explanation about what you have found: e.g., distributions, relationships, correlations, simple statistics, etc.
- 1-2 relationships between variables analysed: Trends, outliers, clusters, some high-level statistics.
- 2-3 hypotheses for further investigation
Visualization project
After these three weeks, students have 3 weeks to come up with some engaging form of presenting the data (group work). This end-piece should help communicating insights from or around the data to a specific audience. This will be shaped by what you think makes most sense for you and the data, but the students will have the final say over their brief. Some outputs might be:
- An interactive web site
- Interactive visualizations on a website
- Data comics
- Infographic
- Physical data visualization
- Data visualization in mixed reality
- Data video
- A standard scientific presentation / report.
- anything else that might address your challenge.
Course Organizers:
- Dr. Benjamin Bach, Reader in Design Informatics and Visualization, School of Informatics http://visualinteractivedata.github.io
- Dr. Lynne Craig, Senior Lecturer, Design, Program Director Design Informatics, Edinburgh College of Art https://www.linkedin.com/in/lynnemurrayprofile/